")
9. Myocardial Infarction
Topics for study:
- Introduction (Read this first)
- Inferior MI Family
- Anterior Q-Wave MI Family
- MI + Bundle Branch Block
- Non Q-Wave MI
- The Pseudoinfarctions
- Miscellaneous QRS Abnormalities
Introduction to ECG Recognition of Myocardial Infarction
When myocardial blood supply is abruptly reduced or cut off to a region of the heart, a sequence of injurious events occur beginning with subendocardial or transmural ischemia, followed by necrosis, and eventual fibrosis (scarring) if the blood supply isn't restored in an appropriate period of time. Rupture of an atherosclerotic plaque followed by acute coronary thrombosis is the usual mechanism of acute MI. The ECG changes reflecting this sequence usually follow a well-known pattern depending on the location and size of the MI. MIs resulting from total coronary occlusion result in more homogeneous tissue damage and are usually reflected by a Q-wave MI pattern on the ECG. MIs resulting from subtotal occlusion result in more heterogeneous damage, which may be evidenced by a non Q-wave MI pattern on the ECG. Two-thirds of MIs presenting to emergency rooms evolve to non-Q wave MI, most having ST segment depression or T wave inversion.
Most MIs are located in the left ventricle. In the setting of a proximal right coronary artery occlusion, however, up to 50% may also have a component of right ventricular infarction as well. Right-sided chest leads are necessary to recognize RV MI.
In general, the more leads of the 12-lead ECG with MI changes (Q waves and ST elevation), the larger the infarct size and the worse the prognosis. Additional leads on the back, V7-9 (horizontal to V6), may be used to improve the recognition of true posterior MI.
The left anterior descending coronary artery (LAD) and its branches usually supply the anterior and anterolateral walls of the left ventricle and the anterior two-thirds of the septum. The left circumflex coronary artery (LCX) and its branches usually supply the posterolateral wall of the left ventricle. The right coronary artery (RCA) supplies the right ventricle, the inferior (diaphragmatic) and true posterior walls of the left ventricle, and the posterior third of the septum. The RCA also gives off the AV nodal coronary artery in 85-90% of individuals; in the remaining 10-15%, this artery is a branch of the LCX.
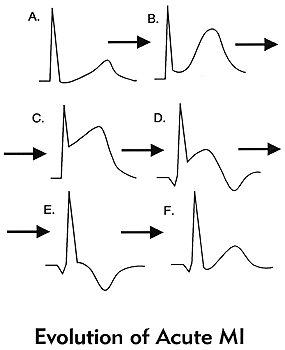
Usual ECG evolution of a Q-wave MI; not all of the following patterns may be seen; the time from onset of MI to the final pattern is quite variable and related to the size of MI, the rapidity of reperfusion (if any), and the location of the MI.
- Normal ECG prior to MI
- Hyperacute T wave changes - increased T wave amplitude and width; may also see ST elevation
- Marked ST elevation with hyperacute T wave changes (transmural injury)
- Pathologic Q waves, less ST elevation, terminal T wave inversion (necrosis)
- (Pathologic Q waves are usually defined as duration ≥ 0.04 s or ≥ 25% of R-wave amplitude)
- Pathologic Q waves, T wave inversion (necrosis and fibrosis)
- Pathologic Q waves, upright T waves (fibrosis)
Inferior MI Family
(includes inferior, true posterior, and right ventricular MI)
Inferior MI
- Pathologic Q waves and evolving ST-T changes in leads II, III, aVF
- Q waves usually largest in lead III, next largest in lead aVF, and smallest in lead II
Example #1: Acute inferior wall ST segment elevation MI (STEMI); note ST segment elevation in leads II, III, aVF; ST segment depression in V1-3 represents true posterior injury.

Example #2: Old inferior Q-wave MI; note largest Q in lead III, next largest in aVF, and smallest in lead II (indicative of right coronary artery occlusion).

True posterior MI
ECG changes are seen in anterior precordial leads V1-3, but are the mirror image of an anteroseptal MI:
- Increased R wave amplitude and duration (i.e., a "pathologic R wave" is a mirror image of a pathologic Q)
- R/S ratio in V1 or V2 > 1 (i.e., prominent anterior forces)
- Hyperacute ST-T wave changes: i.e., ST depression and large, inverted T waves in V1-3
- Late normalization of ST-T with symmetrical upright T waves in V1-3
True posterior MI is often seen with inferior MI (i.e., "inferoposterior MI")
Example #1: 15-lead ECG with acute posterior MI due to left circumflex coronary artery occlusion. Note ST depression in leads V1-6, ST segment elevation in V8-9 (true posterior leads), and slight ST segment elevation in leads I and aVL. ST segment depression in Lead V4R (right chest lead) also indicates left circumflex occlusion.

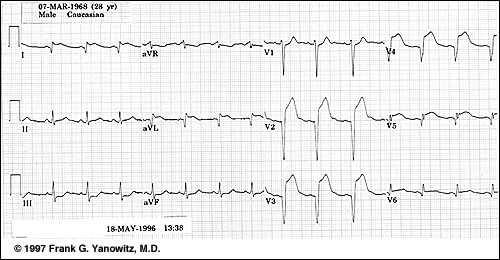
Example #2: Old inferoposterior MI; note tall R waves in V1-3 (mirror image of posterior Q-waves), and deep Q waves in leads II, III, aVF. Residual ST-T wave abnormalities are also evident.

Example #3: Old posterolateral MI (precordial leads): note tall R waves and upright T's in V1-3, and loss of R in V6

Right Ventricular MI (only seen with proximal right coronary occlusion; i.e., with inferior family MI)
-
ECG findings require additional leads on the right chest V1r to V6r as seen in the image below. Note ST segment
elevation in the right chest V3r to V6r indicative of right ventricular injury. Note also the classic findings of
acute inferior STEMI in leads II, III, aVF.

- ST elevation, ≥ 1mm, in right chest leads, especially V4R (see below)

Anterior Family of Q-wave MI
Anteroseptal MI
- Q, QS, or qrS complexes in leads V1-V3 (V4)
- Evolving ST-T changes
Example: Fully evolved anteroseptal MI (note QS waves in V1-2, qrS complex in V3, plus ST-T wave changes)

Anterior MI (similar changes, but usually V1 is spared; if V4-6 involved call it "anterolateral")
Example: Acute anterior or anterolateral MI (note Q's V2-6 plus hyperacute ST-T changes)
High Lateral MI (typical MI features seen in leads I and/or aVL)
Example: note Q-wave, slight ST elevation, and T inversion in lead aVL
MI with Bundle Branch Block
MI + Right Bundle Branch Block
- Usually easy to recognize because Q waves and ST-T changes are not altered by the RBBB
- Example #1: Inferior MI + RBBB (note Q's in II, III, aVF and rSR' in lead V1)

- Example #2: Anterior MI with bifascicular block (RBBB + LAFB). Note pathologic Q-waves in V1-4, late R wave in V1, wide S waves in lead I, and left axis deviation (-80 degrees).


MI + Left Bundle Branch Block
Often a difficult ECG diagnosis because in LBBB the right ventricle is activated first and left ventricular infarct Q waves may not appear at the beginning of the QRS complex (unless the septum is involved).
- Suggested ECG features, not all of which are specific for MI include:
-
Q waves of any size in two or more of leads I, aVL, V5, or V6 (See below: one of the most reliable
signs and probably indicates septal infarction, because the septum is activated early from the right
ventricular side in LBBB)

- Reversal of the usual R wave progression in precordial leads (see above )
-
Q waves of any size in two or more of leads I, aVL, V5, or V6 (See below: one of the most reliable
signs and probably indicates septal infarction, because the septum is activated early from the right
ventricular side in LBBB)
- Notching of the downstroke of the S wave in precordial leads to the right of the transition zone (i.e., before QRS changes from a predominate S wave complex to a predominate R wave complex); this may be a Q-wave equivalent.
- Notching of the upstroke of the S wave in precordial leads to the right of the transition zone (another Q-wave equivalent).
- rSR' complex in leads I, V5 or V6 (the S is a Q-wave equivalent occurring in the middle of the QRS complex)
- RS complex in V5-6 rather than the usual monophasic R waves seen in uncomplicated LBBB; (the S is a Q-wave equivalent).
- "Primary" ST-T wave changes (i.e., ST-T changes in the same direction as the QRS complex rather than the usual "secondary" ST-T changes seen in uncomplicated LBBB); these changes may reflect an acute, evolving MI.

Non-Q Wave MI
- Recognized by evolving ST-T changes over time without the formation of pathologic Q waves (in a patient with typical chest pain symptoms and/or elevation in myocardial-specific enzymes)
- Although it is tempting to localize the non-Q MI by the particular leads showing ST-T changes, this is probably only valid for the ST segment elevation pattern
- Evolving ST-T changes may include any of the following patterns:
- Evolving ST-T changes may include any of the following patterns:
- Convex downward ST segment depression only (common)
- Convex upwards or straight ST segment elevation only (uncommon)
- Symmetrical T wave inversion only (common)
- Combinations of above changes
- Evolving ST-T changes may include any of the following patterns:
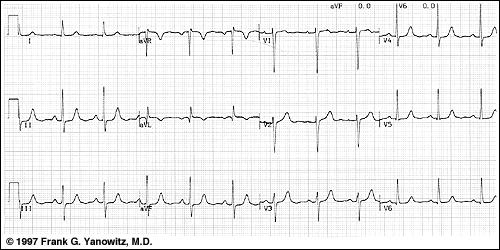
Example: Anterolateral ST-T wave changes

ECG Evidence of Acute Left Main Coronary Artery Occlusion
The electrocardiographic changes suggestive of acute left main coronary occlusion are not to be missed! These include ST segment elevation in lead aVR that is greater than any ST segment elevation in lead V1 plus ST segment depression in 7 or more other leads. These are illustrated in the image below. Patients with these findings need urgent attention in the cardiac catheterization lab.

The Pseudoinfarcts
These are ECG conditions that mimic myocardial infarction either by simulating pathologic Q or QS waves or mimicking the typical ST-T changes of acute MI.
- WPW preexcitation (negative delta wave may mimic pathologic Q waves)
- IHSS (septal hypertrophy may make normal septal Q waves "fatter" thereby mimicking pathologic Q waves)
- LVH (may have QS pattern or poor R wave progression in leads V1-3)
- RVH (tall R waves in V1 or V2 may mimic true posterior MI)
- Complete or incomplete LBBB (QS waves or poor R wave progression in leads V1-3)
- Pneumothorax (loss of right precordial R waves)
- Pulmonary emphysema and cor pulmonale (loss of R waves V1-3 and/or inferior Q waves with right axis deviation)
- Left anterior fascicular block (may see small q-waves in anterior chest leads)
- Acute pericarditis (the ST segment elevation may mimic acute transmural injury)
- Central nervous system disease (may mimic non-Q wave MI by causing diffuse ST-T wave changes)
Miscellaneous Abnormalities of the QRS Complex:
The differential diagnosis of these QRS abnormalities depend on other ECG findings as well as clinical patient information
Poor R Wave Progression - defined as loss of, or no R waves in leads V1-3 (R £2mm):
- Normal variant (if the rest of the ECG is normal)
- LVH (look for voltage criteria and ST-T changes of LV "strain")
- Complete or incomplete LBBB (increased QRS duration)
- Left anterior fascicular block (should see LAD in frontal plane)
- Anterior or anteroseptal MI
- Emphysema and COPD (look for R/S ratio in V5-6 < 1)
- Diffuse infiltrative or myopathic processes
- WPW preexcitation (look for delta waves, short PR)
Prominent Anterior Forces - defined as R/S ration >1 in V1 or V2
- Normal variant (if rest of the ECG is normal)
- True posterior MI (look for evidence of inferior MI)
- RVH (should see RAD in frontal plane and/or P-pulmonale)
- Complete or incomplete RBBB (look for rSR' in V1)
- WPW preexcitation (look for delta waves, short PR)